All case studies

Enterprise product design · Social impact

Resultbook: data that lets impact investors manage their social good.

We worked with Vera Solutions, which builds data solutions for social change, to design Resultbook: a digital platform connecting investors with the impact makers solving the world’s most pressing problems. It’s Vera’s second flagship product.
Client
Vera Solutions
Product
Resultbook
Type
Enterprise product design
Users
NGOs · Funders · Impact investors
Platform
Responsive web app
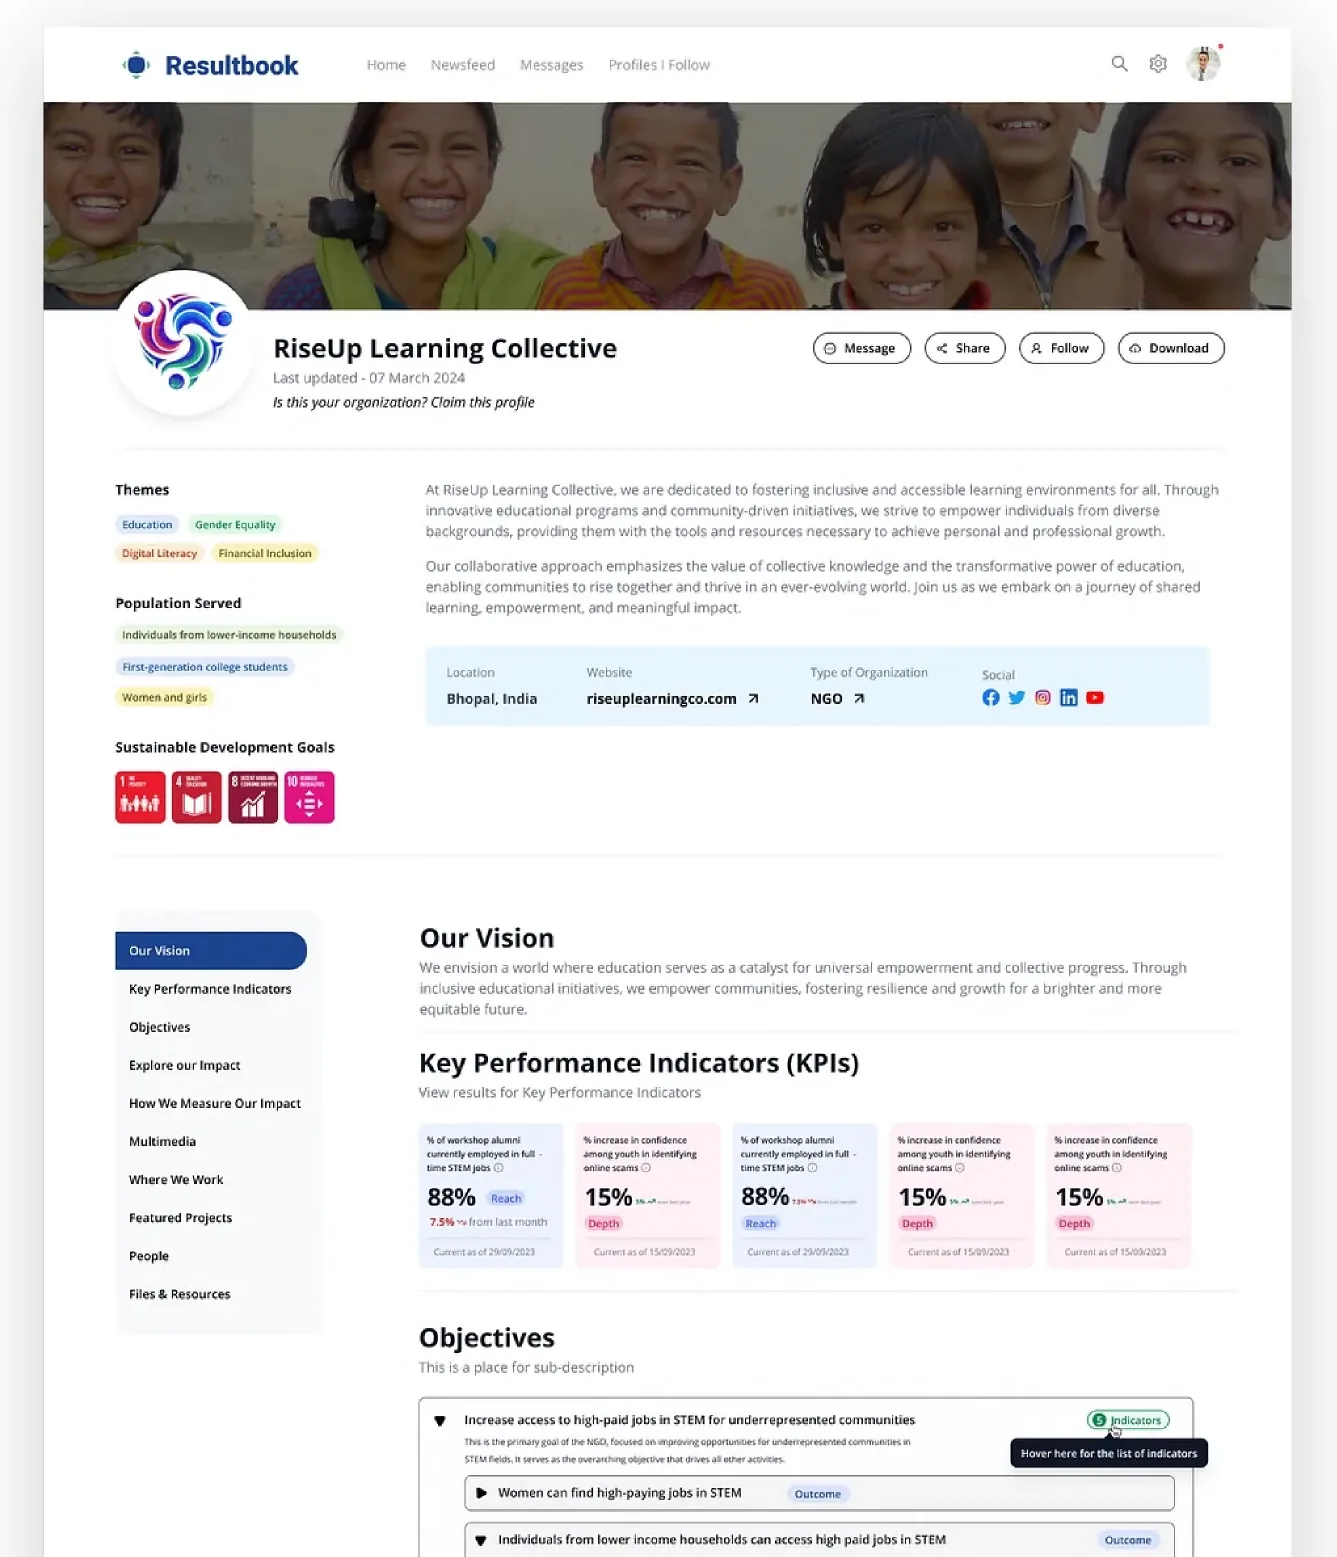
A public Resultbook profile for RiseUp Learning Collective, with themes, population served, Sustainable Development Goals, vision and key performance indicators.

The brief

Make impact visible and fundable.

Impact investors want to manage their social good portfolio with the same clarity as any other portfolio. The organisations they fund, often NGOs working across several geographies, need a simple way to show their work, report their results and keep funders updated.

Resultbook brings both sides onto one platform, harnessing data so investors can see the impact they’re funding and impact makers can prove it.

We designed five core features around that exchange:

Nº1

NGO profile creation

Organisations build and manage their profile content from the back end.

Nº2

Dynamic profile display

A filterable public profile, kept up to date with the impact data funders need.

Nº3

Funding data collection

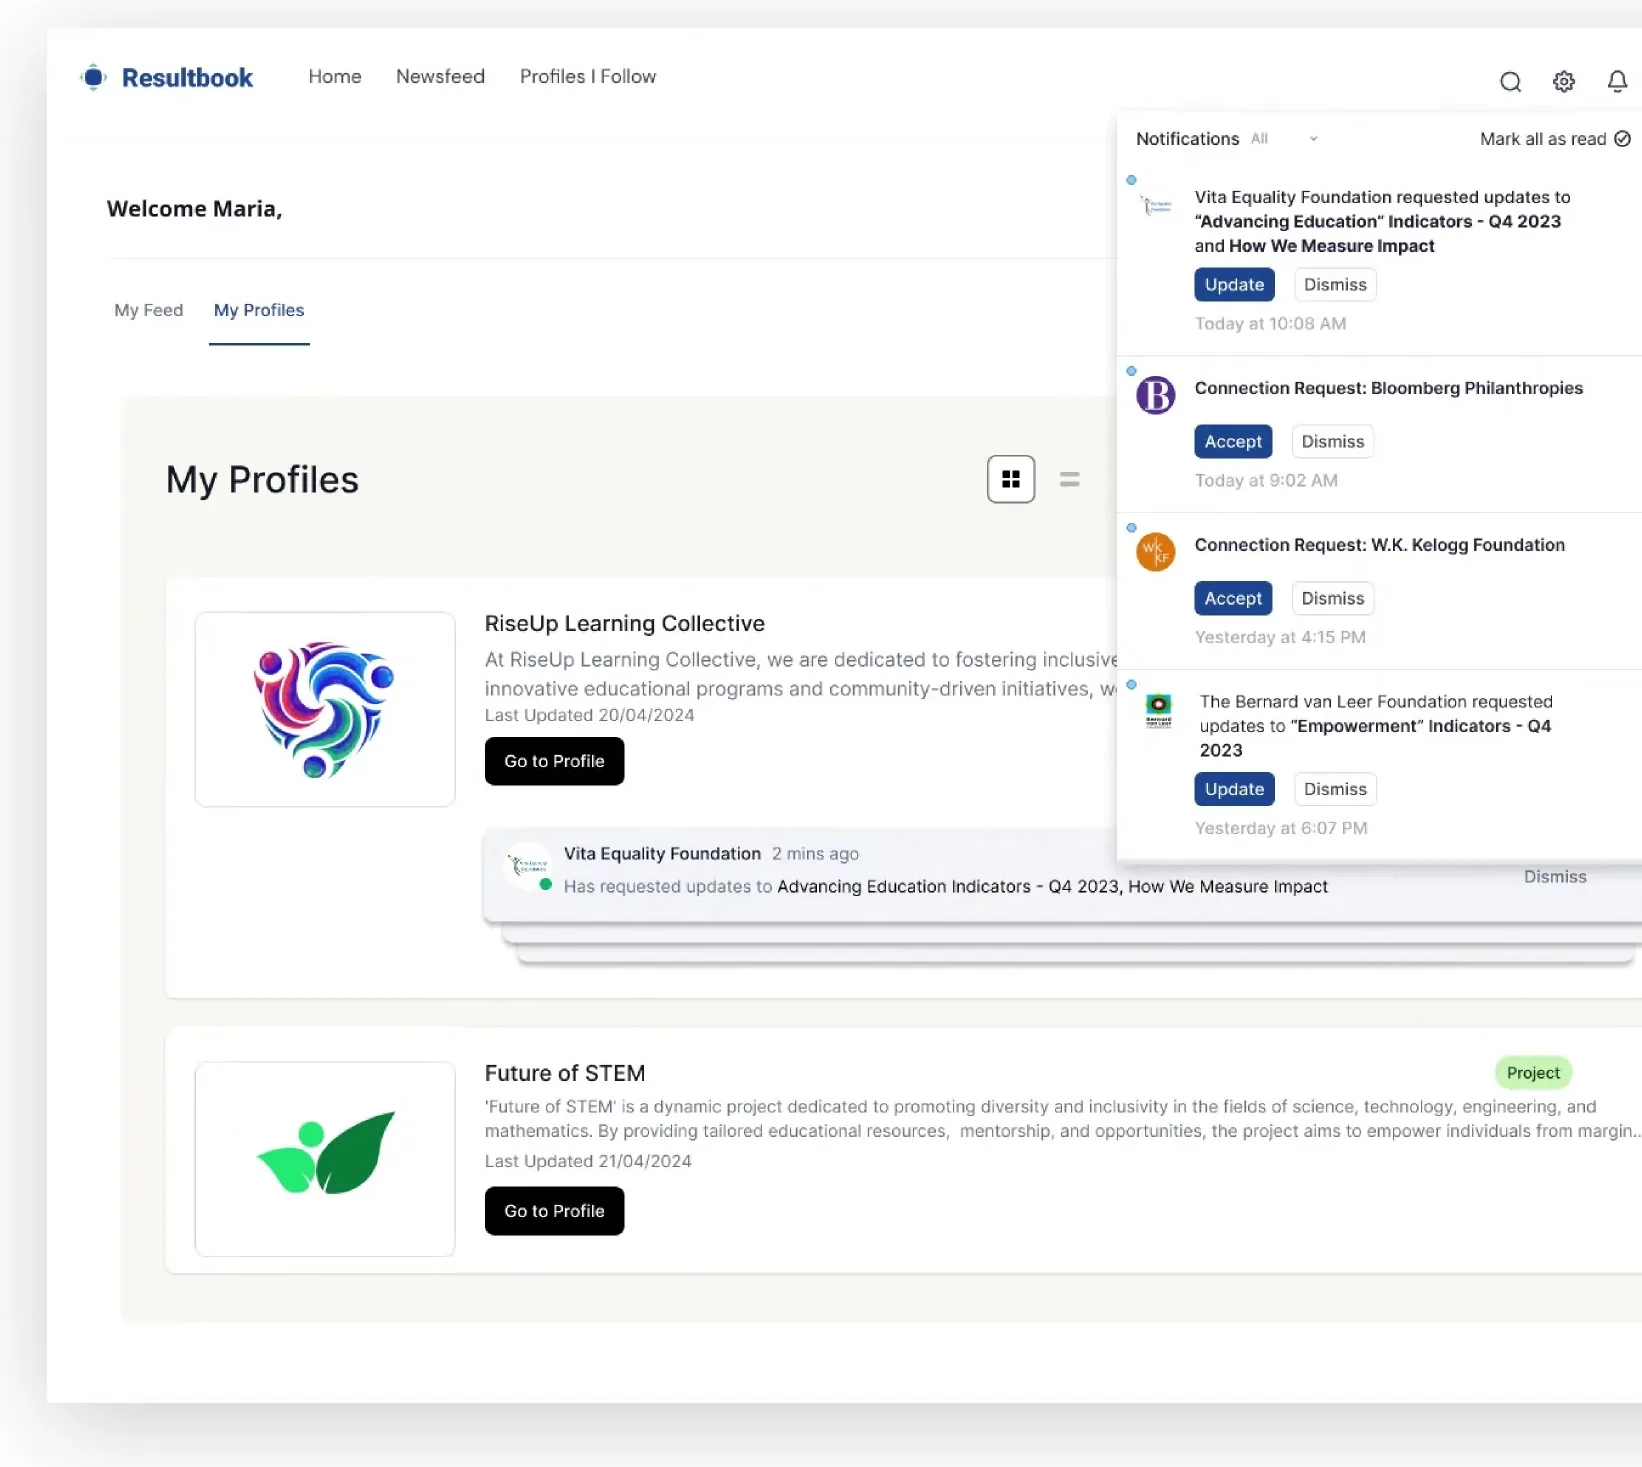
Funding updates exchanged between investors and investees.

Nº4

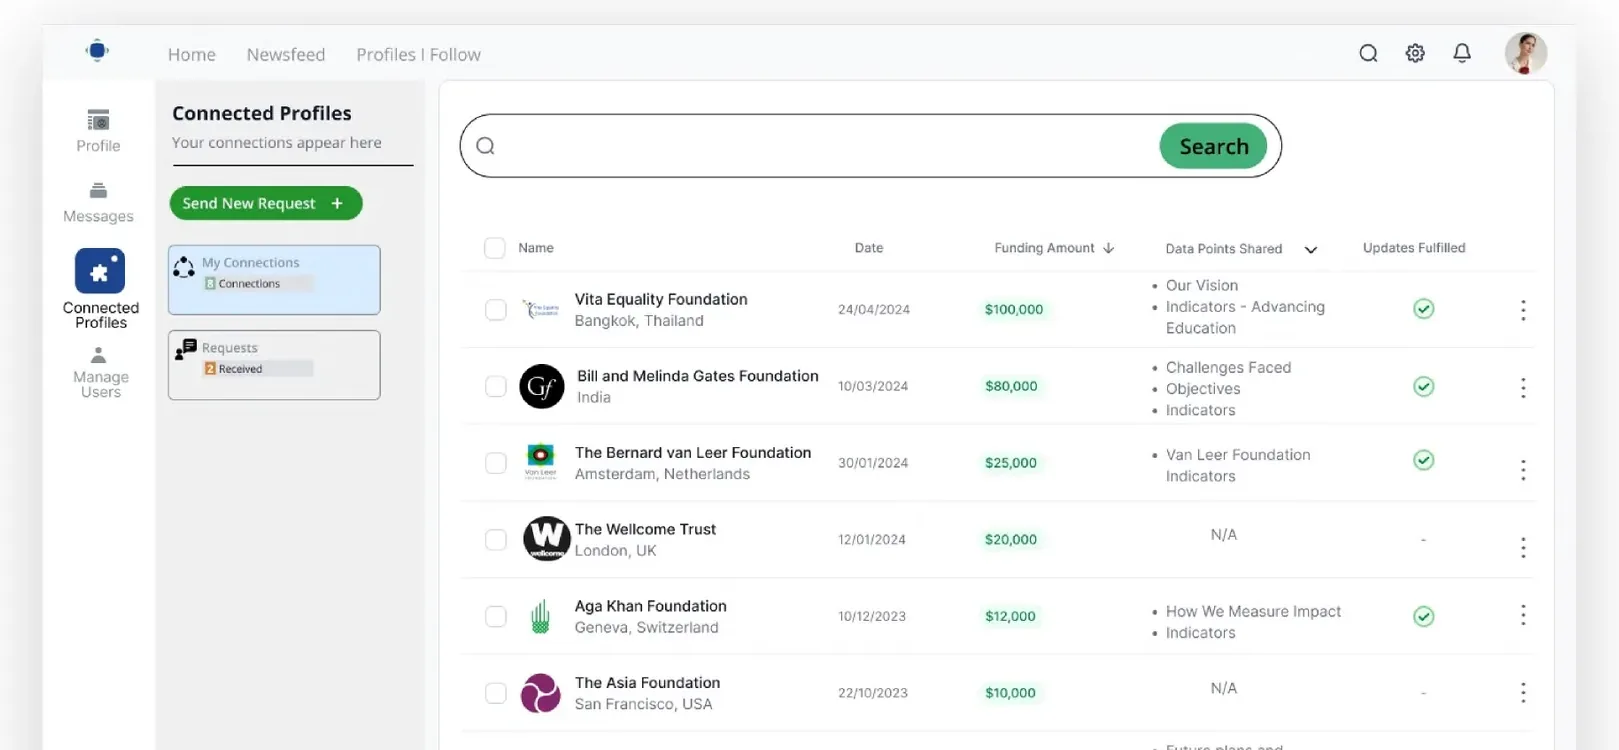
Connected profiles

Multiple profiles across geographies, managed from one account.

Nº5

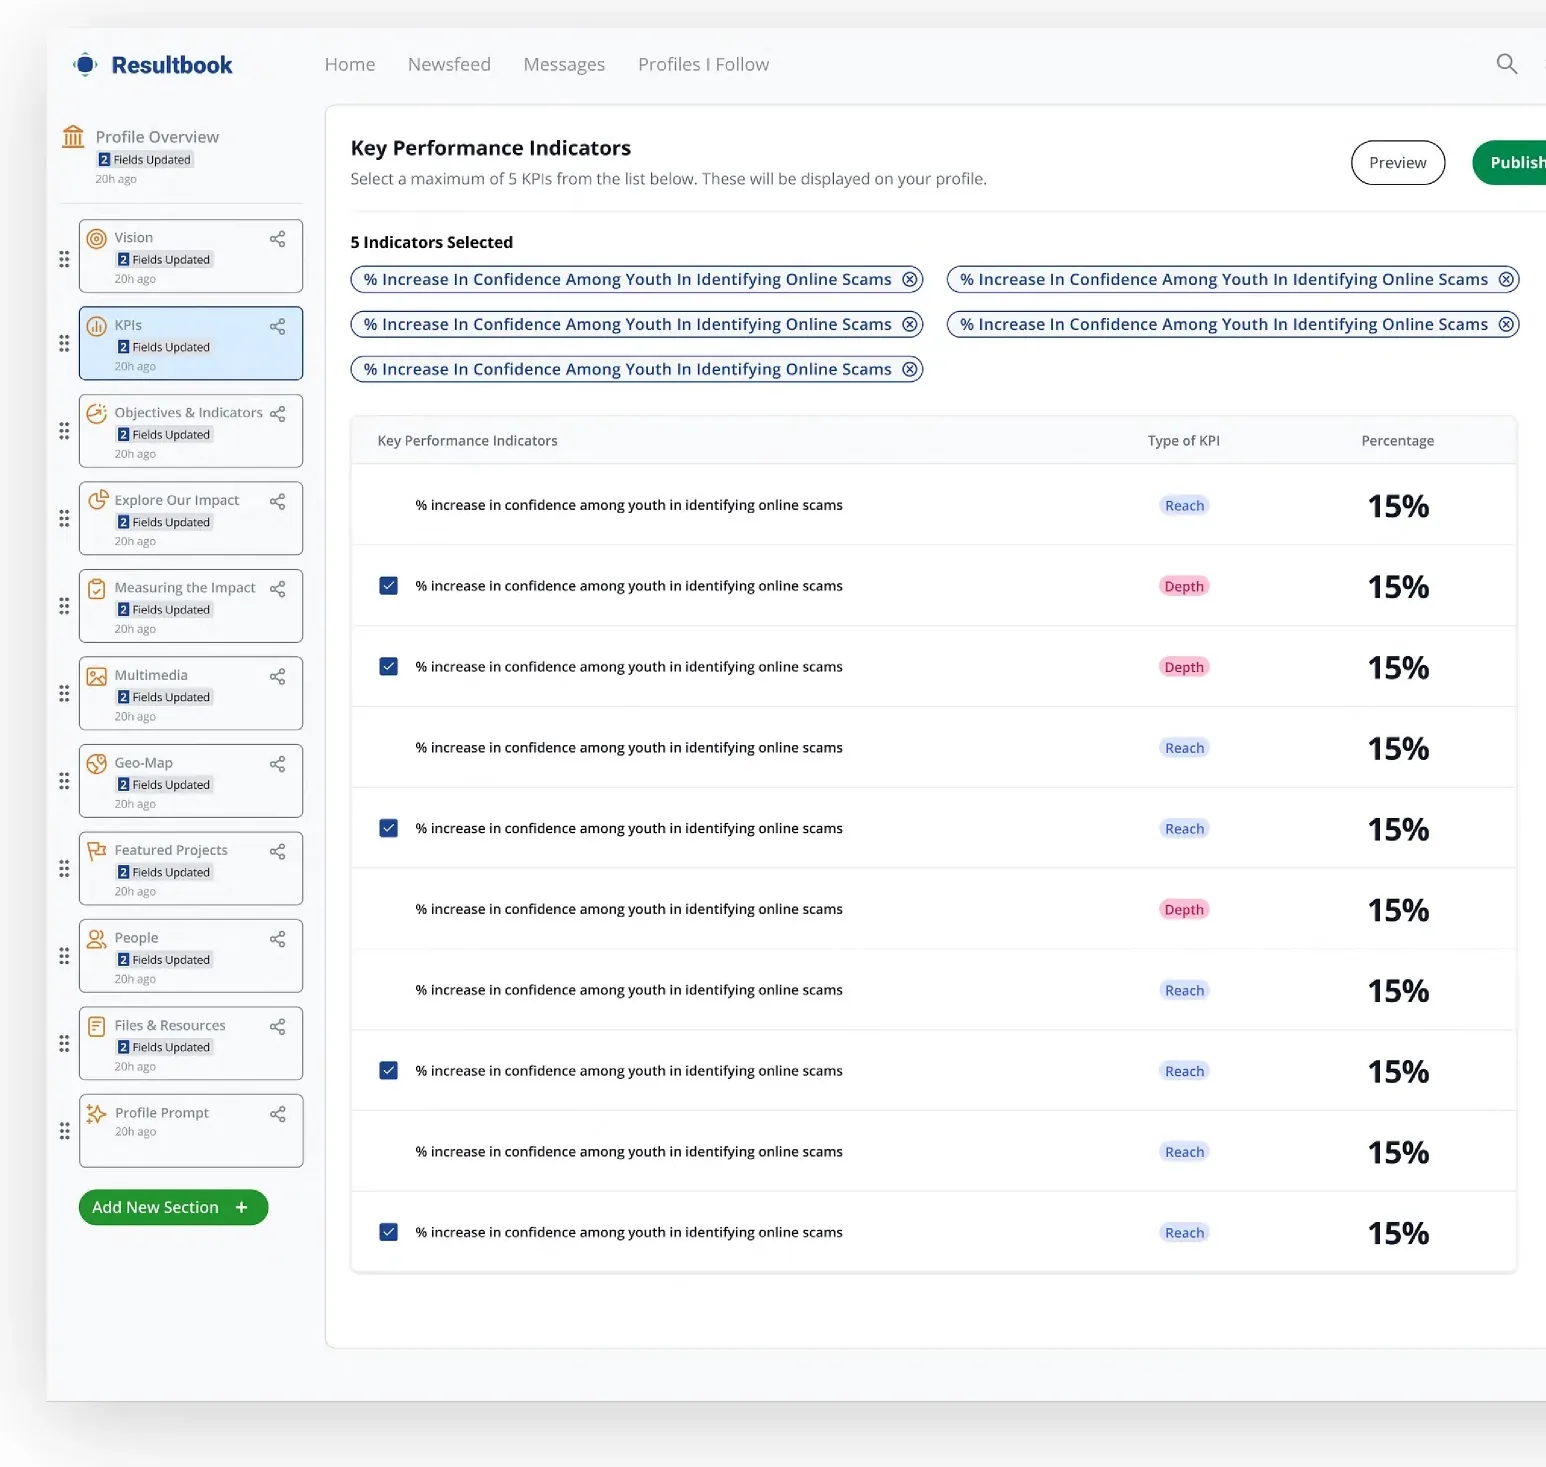
Impact measurement

KPI-by-KPI impact reporting that goes public once published.

Features
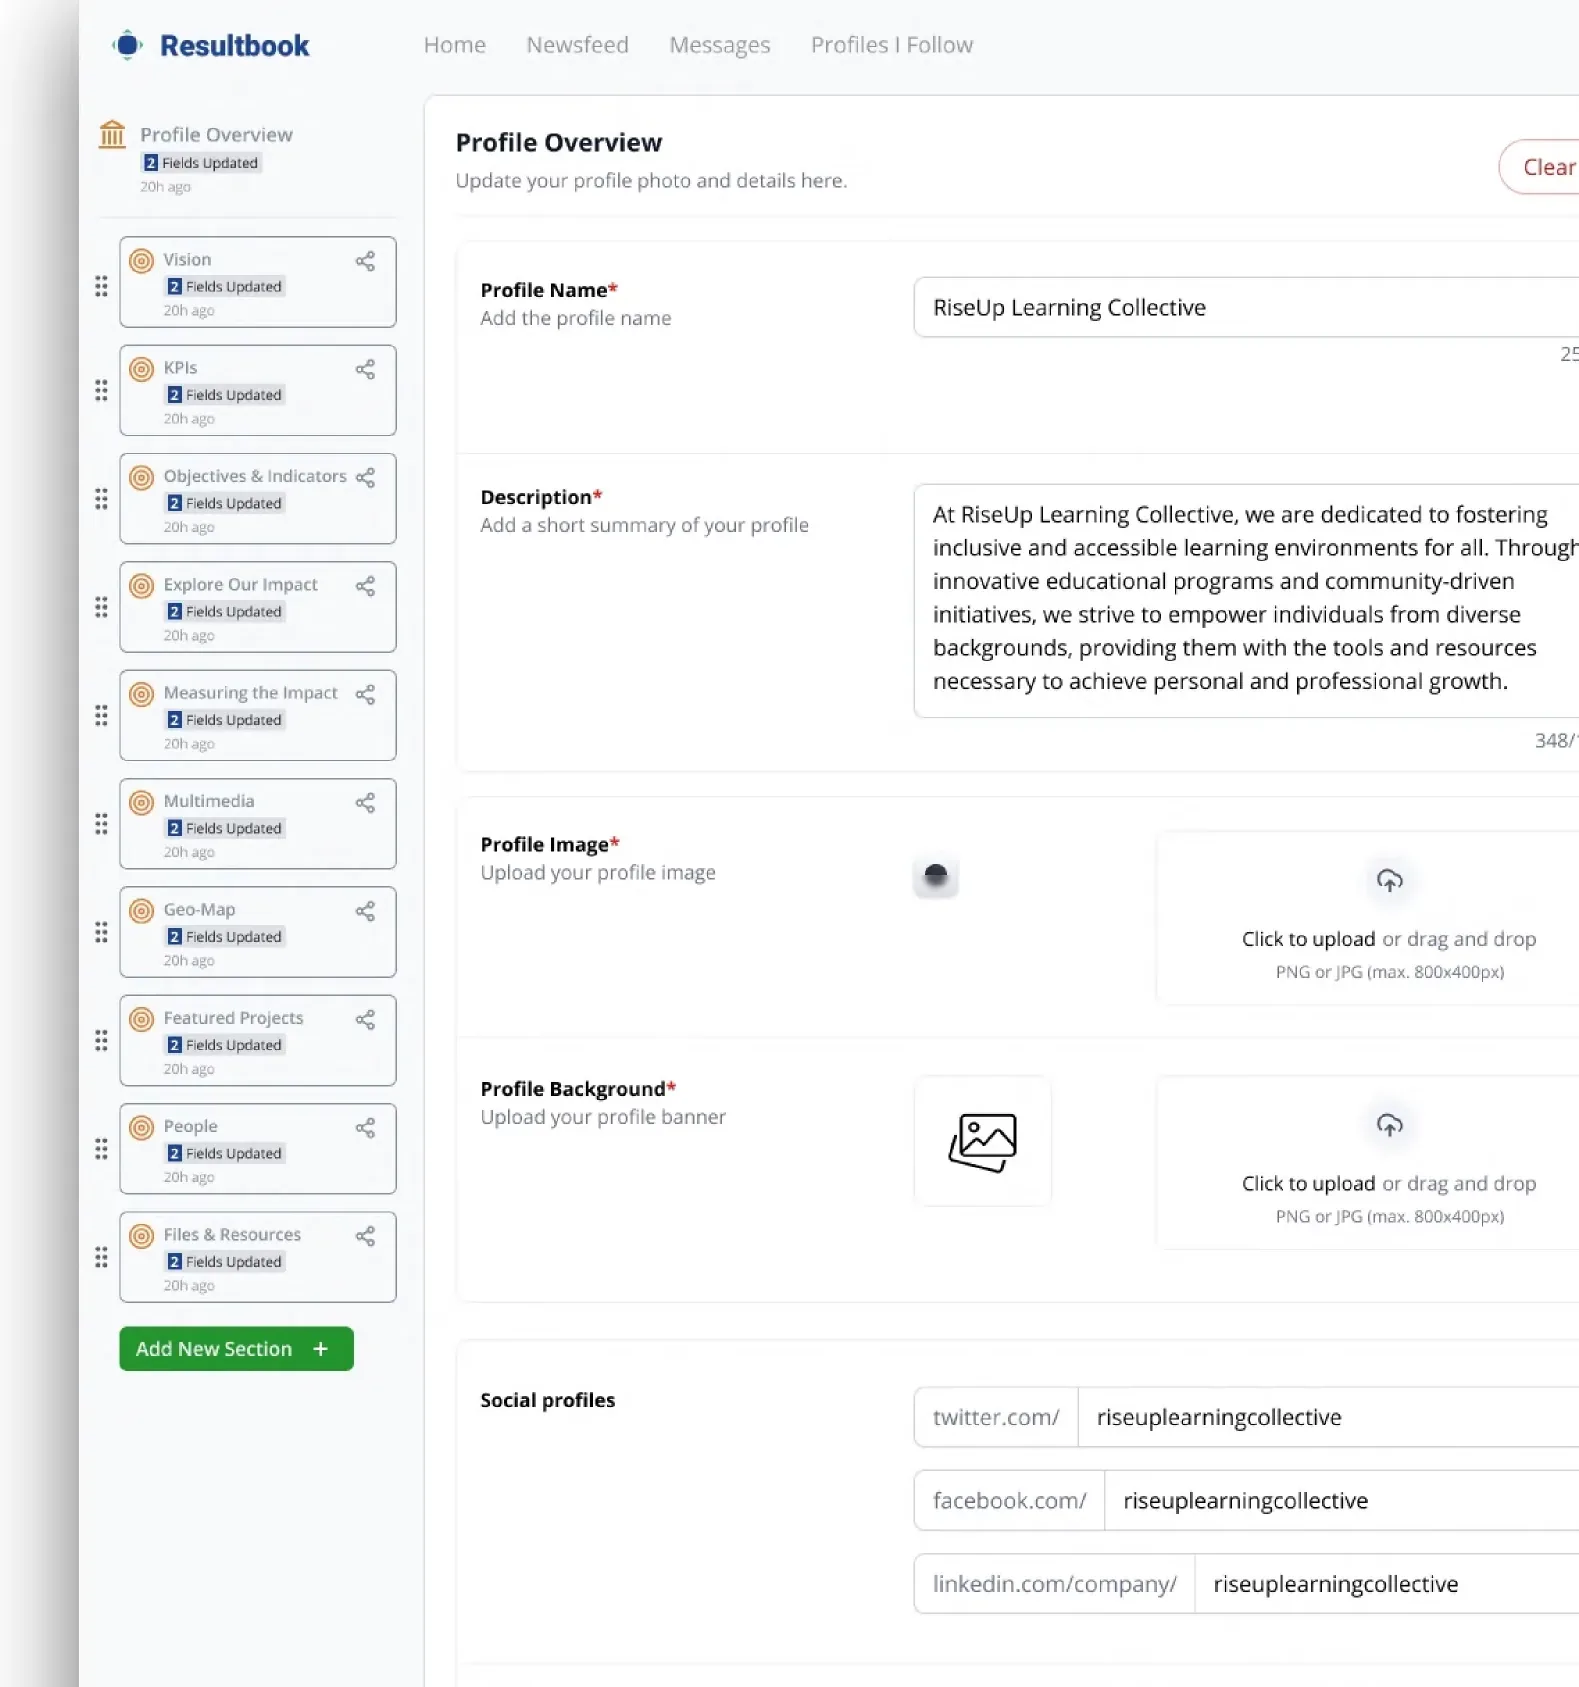
From profile to proof of impact.

Profile Overview editor with a sortable list of profile sections on the left and fields for name, description, profile image, background and social profiles. Public profile for RiseUp Learning Collective with themes, SDG badges, vision, KPI cards and expandable objectives. Connected Profiles table listing foundations with date, funding amount, data points shared and whether updates were fulfilled. My Profiles dashboard with two organisation profiles and a notifications panel of connection and update requests from foundations. Key Performance Indicators editor where five indicators are selected from a list, each with a type tag and percentage.

Approach

Test every assumption, then build.

Following an agile way of working, we constantly tested ideas, strategy and assumptions so the end result stayed aligned with end users’ needs and goals.

  1. Kick offInterviews
  2. Stage 1 · Demo dayResearch, UX & discovery workshops
  3. Stage 2 · Go / no goTesting
  4. Stage 3 · Demo dayUI design
  5. LaunchTesting

Key tasks handled

  • Dashboard designs
  • Login and sign-up design
  • Responsive design
  • Custom UI components
  • Product management
  • Team management
  • In-house workshops
  • Custom branding and UI
  • Design iterations from user and board feedback
  • Rapid prototyping
  • Wireframes and multiple user flows
  • Data visualisation

Tech stack

As an MVP, 0-to-1 design firm, we build custom products on top of existing UI components. It helps ship faster and shortens the time to market.

  • Figma
  • Mantine
  • Ant Design
  • Lucidchart
  • Jira
  • Slack

Launching a flagship product?

Let’s design it around your data.